Rose Rocket Map View
Rose Rocket Map View
ROLE
Product Design
TIMELINE
June 11 - June 25, 2026
TEAM
1 PM,
1 Engineer,
1 Designer (me)
SKILLS
Collaboration, Research, Design System
ROLE
Product Design
TIMELINE
June 11 - June 25, 2026
TEAM
1 PM,
1 Engineer,
1 Designer (me)
SKILLS
Collaboration, Research, Design System
ROLE
Product Design
TIMELINE
June 11 - June 25, 2026
TEAM
1 PM,
1 Engineer,
1 Designer (me)
SKILLS
Collaboration, Research, Design System
OVERVIEW
Freight moves in space. The platform showed it in rows
Rose Rocket is a cloud-based Transportation Management System (TMS) for trucking companies and brokerages, covering the daily operations that keep freight moving: dispatching, billing, communication, and driver management.
Freight moves in space. The platform showed it in rows
Rose Rocket is a cloud-based Transportation Management System (TMS) for trucking companies and brokerages, covering the daily operations that keep freight moving: dispatching, billing, communication, and driver management.
Freight moves in space. The platform showed it in rows
Rose Rocket is a cloud-based Transportation Management System (TMS) for trucking companies and brokerages, covering the daily operations that keep freight moving: dispatching, billing, communication, and driver management.
The Map View sits alongside the existing board and order tools, translating the same operational data into a spatial view. Brokers can see where their fleet is, scan the state of active pickups and deliveries, and get answers at a glance instead of inspecting orders one by one.
PROBLEM
A simple question took a dozen clicks.
To answer a simple question, where's my freight right now, and is it on track, users had to scan boards and open shipments one by one, rebuilding a picture in their head that the data already contained. A map existed, but it sat behind multiple clicks and buried what mattered in menus, so even reaching it didn't answer the question. There was no way to see the network at a glance; status and location stayed locked inside individual records.
A simple question took a dozen clicks.
To answer a simple question, where's my freight right now, and is it on track, users had to scan boards and open shipments one by one, rebuilding a picture in their head that the data already contained. A map existed, but it sat behind multiple clicks and buried what mattered in menus, so even reaching it didn't answer the question. There was no way to see the network at a glance; status and location stayed locked inside individual records.
A simple question took a dozen clicks.
To answer a simple question, where's my freight right now, and is it on track, users had to scan boards and open shipments one by one, rebuilding a picture in their head that the data already contained. A map existed, but it sat behind multiple clicks and buried what mattered in menus, so even reaching it didn't answer the question. There was no way to see the network at a glance; status and location stayed locked inside individual records.
That gap, between what the system knew and what users could see, became the brief.


Faced with this simple question, the goal became clear:
How might we let users read the state of everything in motion without opening a single record?
How might we let users read the state of everything in motion without opening a single record?
APPROACH
New components, familiar foundation.
My first move wasn't to design a map, it was to get fluent in the system I'd be designing into, so I could see what it already solved and where the map needed something new.
New components, familiar foundation.
My first move wasn't to design a map, it was to get fluent in the system I'd be designing into, so I could see what it already solved and where the map needed something new.
New components, familiar foundation.
My first move wasn't to design a map, it was to get fluent in the system I'd be designing into, so I could see what it already solved and where the map needed something new.
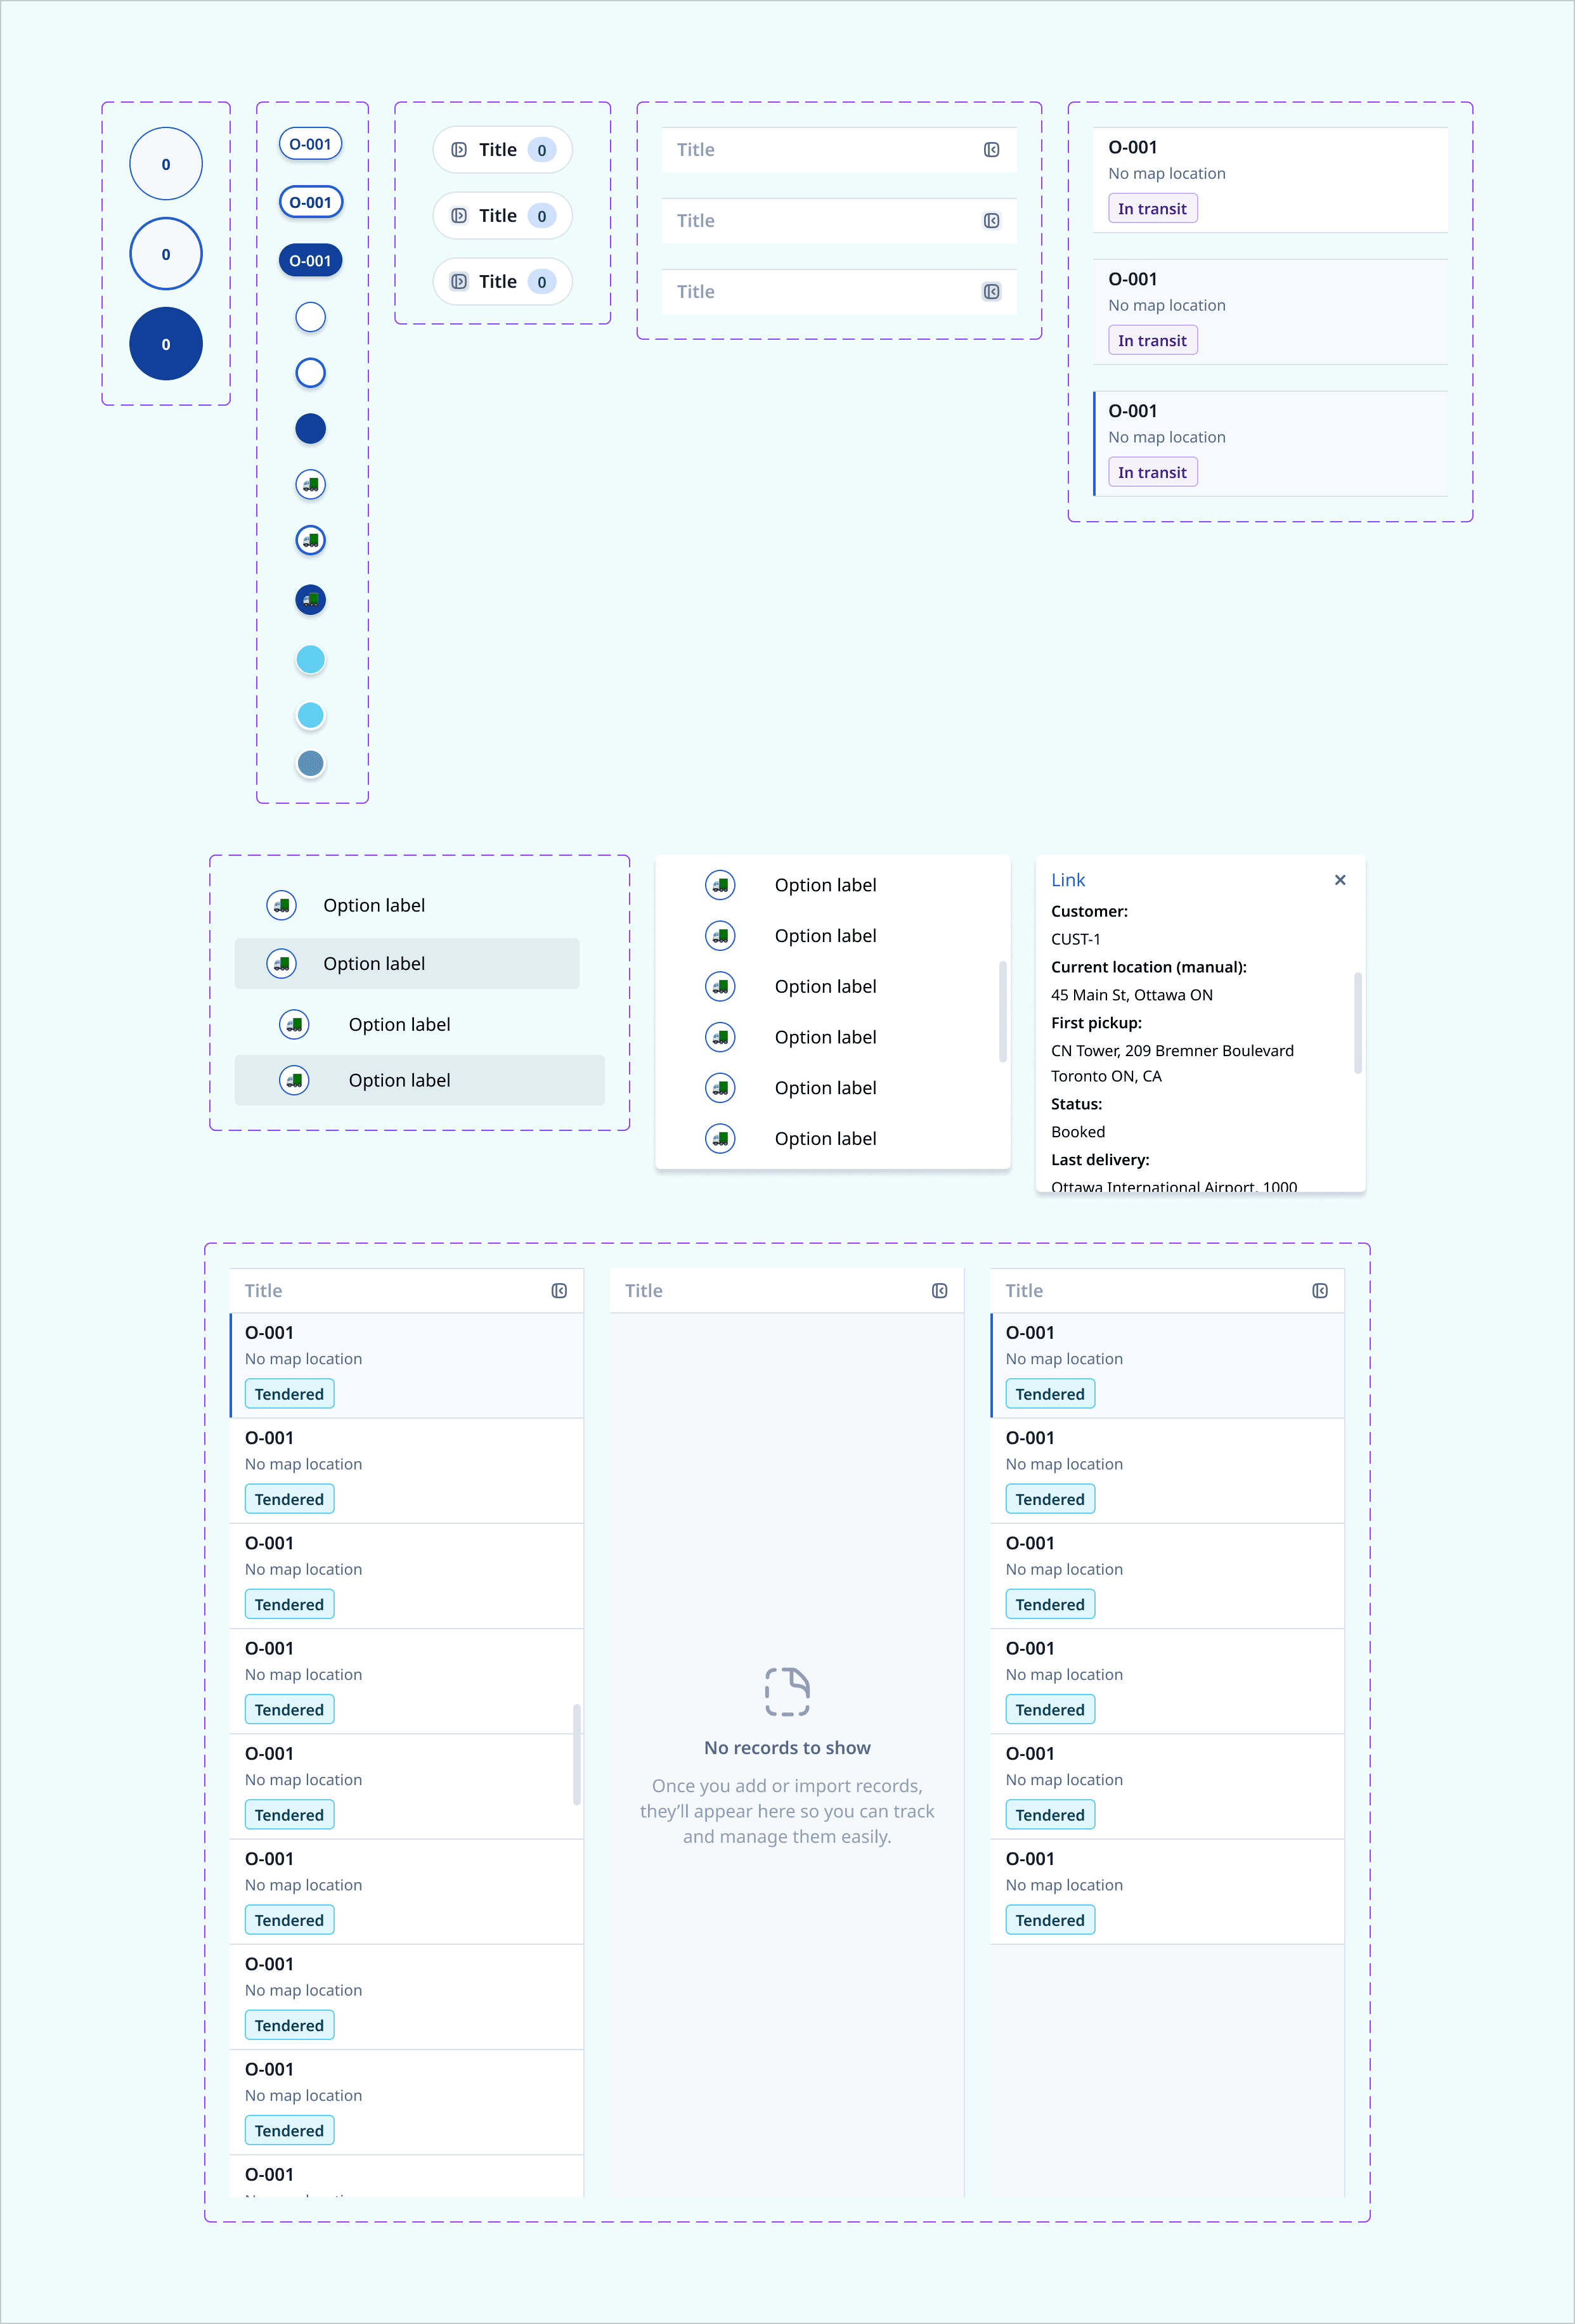
Most of the map's interface didn't exist yet, so I built from existing primitives where I could and created new ones where nothing fit, contributing those back to the system. Building native, with the engineer's work in mind, meant every decision reduced effort downstream instead of adding it. We shipped in about two weeks.
SOLUTION
The whole network, in one view.
The Map View pulls location and status out of individual records and onto a single canvas, the whole fleet, readable at a glance.
The whole network, in one view.
The Map View pulls location and status out of individual records and onto a single canvas, the whole fleet, readable at a glance.
The whole network, in one view.
The Map View pulls location and status out of individual records and onto a single canvas, the whole fleet, readable at a glance.

DESIGN DECISIONS
The decisions that made the map legible.
The choices that kept the map readable as it filled up.
The decisions that made the map legible.
The choices that kept the map readable as it filled up.
The decisions that made the map legible.
The choices that kept the map readable as it filled up.
The map shows where. Not everything.
A table answers what; the map's job was where, so instead of packing detail onto the canvas, I kept it focused on position and let detail live one gesture away. The sidebar lists everything on the map, but selecting an item doesn't expand detail there; it opens that pin's tooltip on the map, where the fields live and the record is one click further. Detail always resolves back to a location, keeping attention where the map is strongest, and the model simple: one place detail appears, not two.
The map shows where. Not everything.
A table answers what; the map's job was where, so instead of packing detail onto the canvas, I kept it focused on position and let detail live one gesture away. The sidebar lists everything on the map, but selecting an item doesn't expand detail there; it opens that pin's tooltip on the map, where the fields live and the record is one click further. Detail always resolves back to a location, keeping attention where the map is strongest, and the model simple: one place detail appears, not two.
The map shows where. Not everything.
A table answers what; the map's job was where, so instead of packing detail onto the canvas, I kept it focused on position and let detail live one gesture away. The sidebar lists everything on the map, but selecting an item doesn't expand detail there; it opens that pin's tooltip on the map, where the fields live and the record is one click further. Detail always resolves back to a location, keeping attention where the map is strongest, and the model simple: one place detail appears, not two.

Built for density from the start.
At any moment the map could hold a huge number of records, stacked on one location, or scattered into noise on zoom-out, so density was the core condition, not an edge case. Clustering kept it readable at any scale, and hovering a cluster peeks inside without a click. The two click targets differ too: click a pin and it opens; click the cluster and the map moves there and breaks it apart.
Built for density from the start.
At any moment the map could hold a huge number of records, stacked on one location, or scattered into noise on zoom-out, so density was the core condition, not an edge case. Clustering kept it readable at any scale, and hovering a cluster peeks inside without a click. The two click targets differ too: click a pin and it opens; click the cluster and the map moves there and breaks it apart.
Built for density from the start.
At any moment the map could hold a huge number of records, stacked on one location, or scattered into noise on zoom-out, so density was the core condition, not an edge case. Clustering kept it readable at any scale, and hovering a cluster peeks inside without a click. The two click targets differ too: click a pin and it opens; click the cluster and the map moves there and breaks it apart.


No two operations are the same, so the map isn't either.
No two brokers or carriers run the same way, so hard-coding what mattered would've been wrong. I pushed for deep customization instead: users define their own pin types and sidebar, a frame they make their own, not a fixed view they adapt to.
No two operations are the same, so the map isn't either.
No two brokers or carriers run the same way, so hard-coding what mattered would've been wrong. I pushed for deep customization instead: users define their own pin types and sidebar, a frame they make their own, not a fixed view they adapt to.
No two operations are the same, so the map isn't either.
No two brokers or carriers run the same way, so hard-coding what mattered would've been wrong. I pushed for deep customization instead: users define their own pin types and sidebar, a frame they make their own, not a fixed view they adapt to.

The polyline, honestly scoped.
The polyline turns scattered points into a path you can follow, but real technical constraints bounded how it could be built. Rather than overreach, we focused it where it delivered: the route for the selected node, shown in context, a smaller version that worked over an ambitious one that didn't.
The polyline, honestly scoped.
The polyline turns scattered points into a path you can follow, but real technical constraints bounded how it could be built. Rather than overreach, we focused it where it delivered: the route for the selected node, shown in context, a smaller version that worked over an ambitious one that didn't.
The polyline, honestly scoped.
The polyline turns scattered points into a path you can follow, but real technical constraints bounded how it could be built. Rather than overreach, we focused it where it delivered: the route for the selected node, shown in context, a smaller version that worked over an ambitious one that didn't.

DESIGN DETAILS
Pins & Records
Anything users track lands as a pin they can hover to preview and open its record, so the map is a way in, not just a picture.
Pins & Records
Anything users track lands as a pin they can hover to preview and open its record, so the map is a way in, not just a picture.
Pins & Records
Anything users track lands as a pin they can hover to preview and open its record, so the map is a way in, not just a picture.

Custom Pins
Users define what they want to track, tailoring the map to how they actually run their operation.
Custom Pins
Users define what they want to track, tailoring the map to how they actually run their operation.
Custom Pins
Users define what they want to track, tailoring the map to how they actually run their operation.
Clustering
At scale, pins collapse into clusters so density stays legible; hover a cluster to see what's inside and jump straight to a specific record.
Clustering
At scale, pins collapse into clusters so density stays legible; hover a cluster to see what's inside and jump straight to a specific record.
Clustering
At scale, pins collapse into clusters so density stays legible; hover a cluster to see what's inside and jump straight to a specific record.
The Sidebar
A customizable panel that adapts to what the user cares about, with considered empty states for when there's nothing to show yet.
The Sidebar
A customizable panel that adapts to what the user cares about, with considered empty states for when there's nothing to show yet.
The Sidebar
A customizable panel that adapts to what the user cares about, with considered empty states for when there's nothing to show yet.
O-101
No map location
MMM DD, YYYY @ 00:00
Pinned fields (6)

 Order ID
 Current location
 StatusTagsCustomer
 Updated at
IMPACT
The most-asked-for view we didn't have.
The Map View launched into demand that already existed. It had been one of the most requested additions to the platform, asked for by customers and pushed for internally, long before it was built. So the win wasn't convincing anyone it was needed; it was delivering something the team and its users had been waiting on, and delivering it fast.
The most-asked-for view we didn't have.
The Map View launched into demand that already existed. It had been one of the most requested additions to the platform, asked for by customers and pushed for internally, long before it was built. So the win wasn't convincing anyone it was needed; it was delivering something the team and its users had been waiting on, and delivering it fast.
The most-asked-for view we didn't have.
The Map View launched into demand that already existed. It had been one of the most requested additions to the platform, asked for by customers and pushed for internally, long before it was built. So the win wasn't convincing anyone it was needed; it was delivering something the team and its users had been waiting on, and delivering it fast.
Full adoption metrics are still being collected as the feature rolls out, but the early signal is clear, this is being treated as a major step for the platform, not an incremental one.
REFLECTION
What I have learned so far
A design system is a force multiplier.
Working this fast only happened because the system let it. Getting fluent in it early meant I could tell what to reuse and what to build, and building native — even the new primitives — kept everything legible to the people around me. I came away seeing a mature design system less as a constraint and more as leverage: the thing that lets one designer ship at the scope this needed.
Polish comes from building together.
The map's details got sharp because they were refined live, not handed off. Designing in tight loops with one engineer meant decisions were pressure-tested against what was actually buildable in the moment, and small refinements happened in conversation instead of another round of tickets. The closeness is what made the quality — and the timeline — possible.
A design system is a force multiplier.
Working this fast only happened because the system let it. Getting fluent in it early meant I could tell what to reuse and what to build, and building native — even the new primitives — kept everything legible to the people around me. I came away seeing a mature design system less as a constraint and more as leverage: the thing that lets one designer ship at the scope this needed.
Polish comes from building together.
The map's details got sharp because they were refined live, not handed off. Designing in tight loops with one engineer meant decisions were pressure-tested against what was actually buildable in the moment, and small refinements happened in conversation instead of another round of tickets. The closeness is what made the quality — and the timeline — possible.